AI in code debugging and error detection is transforming by providing developers with powerful tools to identify and resolve issues faster. Traditional debugging often requires extensive manual effort, from reviewing logs to pinpointing syntax errors and logical inconsistencies. AI in code debugging tools streamline this process by analyzing patterns, predicting potential errors, and offering intelligent suggestions for fixes.
By integrating AI into debugging workflows, developers can detect issues in real-time, improve code quality, and optimize performance. AI tools analyze vast amounts of code data, recognizing recurring patterns and providing insights that help prevent future errors. Features such as automated bug detection, security vulnerability analysis, and AI-assisted refactoring enhance efficiency and reduce the time spent troubleshooting.
These tools integrate seamlessly with popular development environments, supporting multiple programming languages and frameworks. Whether refining logic, improving security, or enhancing maintainability, AI assists in making debugging more efficient. As AI technology continues to advance, its role in software development will expand, allowing developers to write cleaner, more secure, and more reliable code with greater ease.
Key Takeaways
- AI accelerates debugging by identifying syntax errors, logic flaws, and vulnerabilities in real-time.
- Machine learning models analyze patterns to detect recurring issues and suggest optimized fixes.
- Security-focused AI solutions help prevent vulnerabilities such as SQL injection and authentication flaws.
- Automated debugging reduces manual effort, allowing developers to focus on enhancing code quality and performance.
- Multi-language support ensures AI in code debugging works across different programming environments.
- AI-powered recommendations enhance collaboration, enabling teams to resolve issues faster.
- Advanced AI debugging tools continuously learn from codebases, improving accuracy over time.
- Balancing AI assistance with human oversight ensures high-quality, secure, and reliable software development.
The Role of AI in Code Debugging
AI transforms how programmers fix bugs. It spots errors quickly and handles tedious debugging tasks, making coding smoother for web developers and testers.
Automating repetitive debugging tasks
Debugging repetitive tasks slows down software development. AI in code debugging tools simplifies this process by automating error detection patterns, reducing manual effort. Tools like Microsoft Copilot or IntelliJ IDEA Debugger scan lines of code to pinpoint problems in seconds. Developers save up to 40% of their time, accelerating release cycles and increasing productivity.
These tools work with continuous testing frameworks like Selenium IDE or WebDriver, making automation efficient. Before they escalate, they identify recurring issues, such as syntax errors during compile stages or minor bugs in Python scripts. Streamlined workflow allows testers to concentrate on complex fixes instead of repeating basic checks, resulting in improved precision techniques.
Enhancing precision in error detection
AI tools, like TensorBoard and IntelliJ IDEA Debugger, identify errors faster than humans. They examine extensive code using machine learning algorithms, finding patterns in syntax mistakes or runtime issues that developers might overlook.
Explainable AI methods, such as SHAP and LIME, clarify why an error occurs. They simplify complex decisions into manageable steps for easier comprehension. This assists coders in addressing bugs swiftly without questioning the tool’s recommendations.
Precise error detection results in dependable solutions with better scalability and performance optimization. Machine learning-based recognition reduces security vulnerabilities while enhancing unit tests’ efficiency.
How AI in Code Debugging Works
AI debuggers use smart algorithms to find patterns in code. They can spot issues quickly, suggest quick fixes, and explain errors clearly.
Machine learning-based pattern recognition
Machine learning finds patterns in code errors. It scans large datasets, spotting bugs like infinite loops. Break conditions are suggested to fix issues faster.
This process uses recognition algorithms to detect repeated mistakes or unusual behavior in scripts. Tools leverage predictive analytics and root cause analysis for precise debugging across development environments.
Pattern recognition helps reduce error detection time significantly.
Generative AI for automated code suggestions
These tools study patterns in existing code to offer solutions or improvements. Developers save hours by avoiding repetitive tasks during debugging or refining workflows. AI improves usability in integrated development environments (IDEs) like VS Code, streamlining the coding process.
Natural language processing for error explanations
Natural language processing (NLP) makes error explanations easier for developers. AI tools use NLP to convert technical terms into straightforward language, allowing both beginners and experts to understand issues quickly and efficiently.
CHATDBG, as an illustration, employs large language models to provide interactive error explanations. It simplifies complicated debugging messages into clear steps or recommendations.
Developers can resolve problems more quickly and enhance code quality with this method.
Key Benefits of Using AI in Code Debugging
AI speeds up bug detection and smooths coding. It saves time, boosts accuracy, and helps developers focus on creating better programs.
Faster identification of bugs
AI tools review lines of code rapidly, detecting errors more swiftly than conventional methods. TensorBoard, for example, monitors live metrics and identifies irregularities during execution. Developers save significant time by bypassing manual reviews and addressing directly flagged issues.
Recurring patterns in error-prone sections become simpler to recognize as AI adapts to various code architectures. This aids in preventing repeated mistakes across different platforms. Increased accuracy contributes to better code quality.
Improved code quality and reliability
AI in code debugging tools reduces bugs in production, increasing code quality. Automated tests and intelligent code completions catch errors early, lowering risks before deployment. This means fewer crashes in web applications and ERP systems.
AI uses learned patterns to fix issues fast. Testing tools spot problems like memory leaks or runtime errors without manual checks. Developers can refactor code with higher confidence, ensuring easier maintenance later. Advanced AI helps deliver reliable performance across multiple platforms. Moving on to how AI speeds up bug detection.
Reduced debugging time and cost
AI in code debugging tools, like SmythOS, cut troubleshooting time by 50%. Companies using these tools reduce expenses by up to 30%. Automation speeds up spotting and fixing errors in web apps, CRM systems, or cloud-based environments. Debugging repetitive issues gets easier with AI features such as test automation frameworks and error detection scripts.
This boosts efficiency across the development cycle. AI identifies problems quickly—handling runtime errors or performance-tuning tasks without slowing developers down. Tools like Bing Chat assist directly during coding sessions for instant solutions.
Less wasted time means lower business costs relying on continuous delivery pipelines or progressive web app development.
Top Tools for AI in Code Debugging and Error Detection
AI in code debugging tools helps developers identify and resolve errors efficiently, ensuring code quality and security. These tools integrate with IDEs, analyze patterns, and provide real-time suggestions to improve efficiency. Here’s a look at some of the leading AI in code debugging tools.
Microsoft Copilot
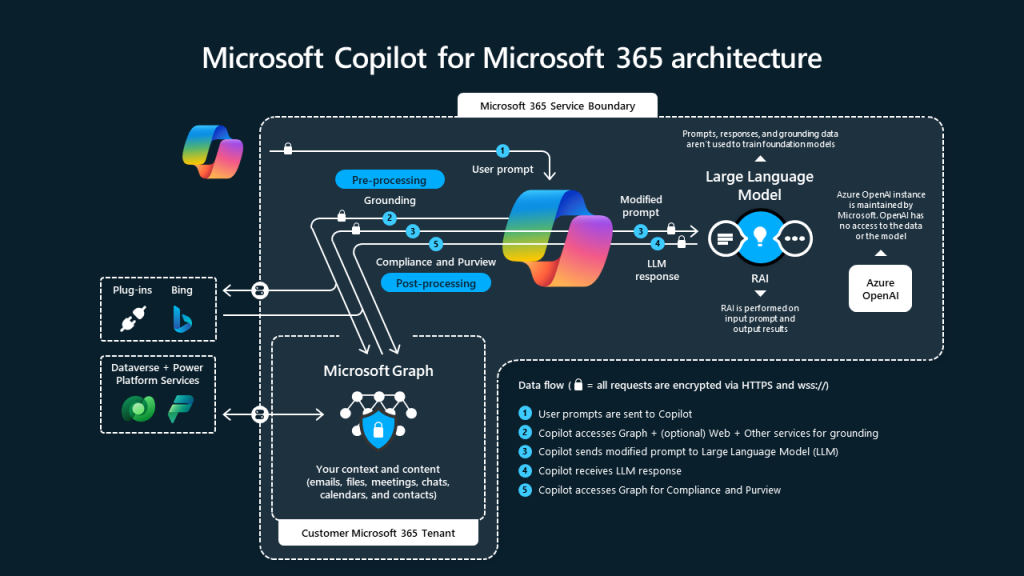
Microsoft Copilot, integrated into Visual Studio and GitHub, enhances the debugging experience by leveraging AI to analyze code, suggest fixes, and automate routine debugging tasks. It provides intelligent insights, allowing developers to resolve errors faster and improve code reliability.
Key Features
| Feature | Description 1 | Description 2 |
|---|---|---|
| AI-Powered Debugging Assistance | Identifies syntax errors and logical flaws. | Speeds up issue resolution by providing relevant fixes. |
| Code Refactoring Suggestions | Optimizes code structure for better readability. | Reduces technical debt by suggesting improvements. |
| Seamless Integration with Visual Studio | Works within Microsoft’s development ecosystem. | Enhances productivity by keeping the workflow intact. |
| Predictive Issue Detection | Analyzes patterns to detect potential problems early. | Helps prevent common errors before deployment. |
| Multi-Language Support | Compatible with C#, Python, JavaScript, and more. | Supports various development environments. |
Pricing
- Free Plan: Available for individual developers.
- Enterprise Plan: Custom pricing based on team requirements.
Reviews and Ratings
- G2: Rated 4.6/5 for its deep integration with Visual Studio.
- Capterra: Rated 4.5/5, praised for improving debugging efficiency.
Pros and Cons of Microsoft Copilot
| Pros | Cons |
|---|---|
| Seamless integration with Visual Studio. | Limited support outside of Microsoft’s ecosystem. |
| AI-driven debugging for faster error resolution. | Advanced features may require a paid plan. |
| Improves code readability with refactoring suggestions. | Requires an internet connection for real-time AI-powered debugging. |
| Supports multiple programming languages. | May generate redundant suggestions, requiring manual validation. |
Metabob
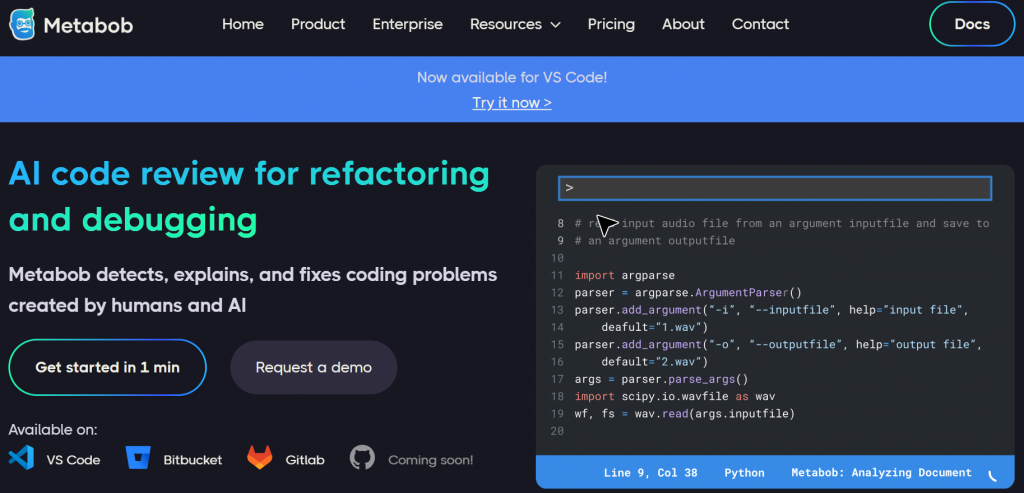
Metabob is an AI in code debugging is designed to detect logical errors and inefficiencies in code. Unlike standard linters, Metabob uses machine learning to analyze patterns and provide deeper insights into potential issues.
Key Features
| Feature | Description 1 | Description 2 |
|---|---|---|
| AI-Based Error Detection | Identifies logical flaws and performance bottlenecks. | Helps developers optimize code for efficiency. |
| Code Quality Insights | Analyze the structure and highlight areas for improvement. | Ensures maintainability and readability. |
| Collaboration Tools | Allows teams to review and fix errors together. | Enhances workflow for development teams. |
| Context-Aware Suggestions | Provides fixes based on code context. | Reduces time spent on manual debugging. |
| Multi-Language Support | Works with Python, JavaScript, Java, and C++. | Suitable for developers across different domains. |
Pricing
- Free Plan: Includes basic AI-powered debugging.
- Premium Plan: Custom pricing for advanced debugging features.
Reviews and Ratings
- G2: Rated 4.5/5 for its AI-driven logic analysis.
- Capterra: Rated 4.4/5, recognized for improving code quality.
Pros and Cons of Metabob
| Pros | Cons |
|---|---|
| Detects logical errors beyond standard liters. | The learning curve for developers new to AI debugging. |
| Offers AI-driven insights for better code efficiency. | Some advanced features require a paid plan. |
| Encourages collaboration with team-based debugging. | Cloud-based analysis raises security concerns |
| Supports multiple programming languages. | Limited support for certain programming languages |
IntelliJ IDEA’s AI Debugger
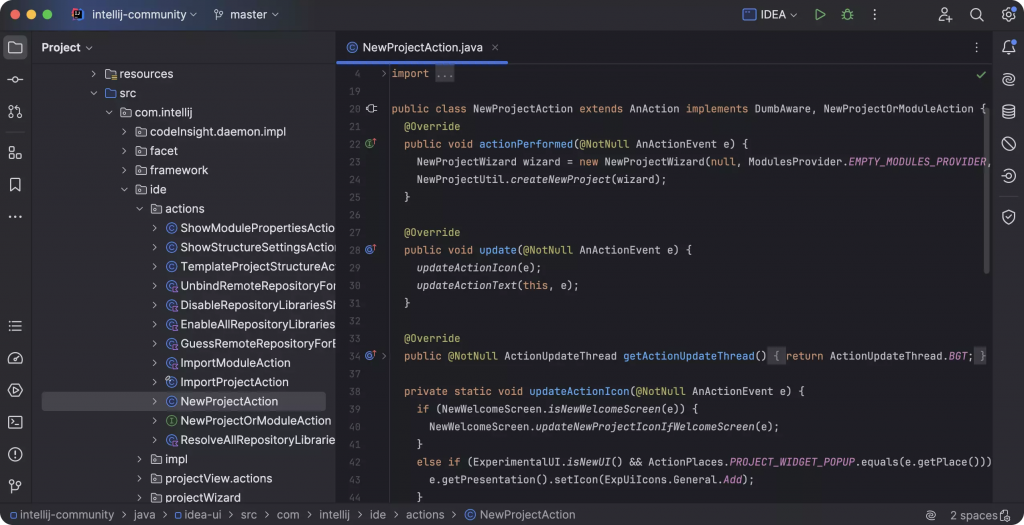
IntelliJ IDEA’s AI Debugger enhances the debugging process by providing smart suggestions, auto-fixing errors, and improving code quality. As part of JetBrains’ ecosystem, it integrates seamlessly with IntelliJ IDEA and other JetBrains tools.
Key Features
| Feature | Description 1 | Description 2 |
|---|---|---|
| AI-Assisted Debugging | Detects runtime and logic errors instantly. | Helps developers troubleshoot issues efficiently. |
| Smart Code Completion | Provides context-aware suggestions. | Reduces debugging time by improving accuracy. |
| Seamless JetBrains Integration | Works with IntelliJ IDEA and PyCharm. | Enhances productivity within the JetBrains ecosystem. |
| Error Explanation and Fixes | Offers insights into why errors occur. | Guides developers toward better solutions. |
| Multi-Language Compatibility | Supports Java, Kotlin, Python, and more. | Suitable for full-stack and enterprise developers. |
Pricing
- Free Plan: Included with IntelliJ IDEA Community Edition.
- Ultimate Plan: $24.90/month per user with advanced AI debugging features.
Reviews and Ratings
- G2: Rated 4.7/5 for deep integration with JetBrains tools.
- Capterra: Rated 4.6/5, praised for accuracy and efficiency.
Pros and Cons of IntelliJ IDEA AI Debugger
| Pros | Cons |
|---|---|
| Integrates seamlessly with JetBrains tools. | Best suited for developers using IntelliJ IDEA. |
| Offers AI-driven insights for efficient debugging. | Requires a paid subscription for full features. |
| Smart code suggestions improve code quality. | May sometimes suggest unnecessary code modifications. |
| Supports multiple programming languages. | Heavy resource consumption in large-scale projects. |
TensorBoard
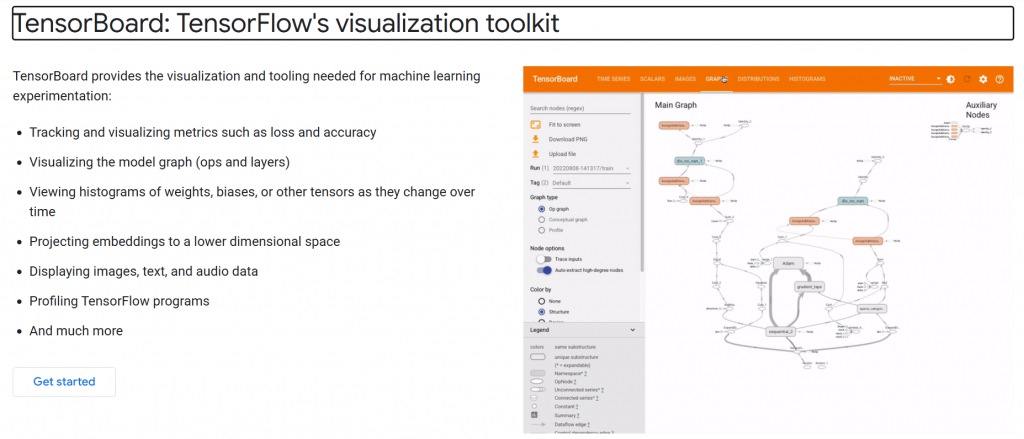
TensorBoard, developed by Google, is a visualization tool that aids in debugging machine learning models. It provides insights into training performance, model architecture, and potential issues in AI-driven applications.
Key Features
| Feature | Description 1 | Description 2 |
|---|---|---|
| Real-Time Model Debugging | Tracks training metrics and logs. | Helps diagnose issues in ML model performance. |
| Graph Visualization | Displays neural network architectures. | Provides insights into model behavior and structure. |
| Hyperparameter Tuning Support | Compares different model runs. | Optimizes AI models for better accuracy. |
| Seamless TensorFlow Integration | Works directly with TensorFlow models. | Enhances debugging for AI and deep learning applications. |
| Scalability for Large Models | Supports high-dimensional data visualization. | Useful for researchers and AI engineers. |
Pricing
- Free: Available as part of TensorFlow’s open-source package.
Reviews and Ratings
- G2: Rated 4.8/5 for machine learning debugging.
- Capterra: Rated 4.7/5, highly regarded for deep learning visualization.
Pros and Cons of TensorBoard
| Pros | Cons |
|---|---|
| Provides deep insights into AI models. | Primarily designed for machine learning debugging. |
| Supports TensorFlow integration. | The learning curve for developers new to ML debugging. |
| Helps optimize model performance and accuracy. | Can be resource-intensive, especially when visualizing large datasets. |
| Free and open-source for all users. | Limited direct integration with traditional software development tools outside of AI/ML. |
Final Thoughts
AI in code debugging tools provides significant advantages in improving code reliability, detecting errors, and ensuring security.
- Microsoft Copilot is ideal for developers using Visual Studio, offering AI-assisted debugging and code refactoring.
- Metabob focuses on logic-based error detection and team collaboration for code review.
- IntelliJ IDEA AI Debugger enhances the JetBrains ecosystem with smart debugging and automated fixes.
- TensorBoard is an essential tool for machine learning developers, providing deep insights into model performance.
Choosing the right debugging tool depends on project requirements, the development environment, and the need for security and performance optimization. AI in code debugging solutions continues to evolve, making software development more efficient and accurate.
Types of Errors AI Can Detect
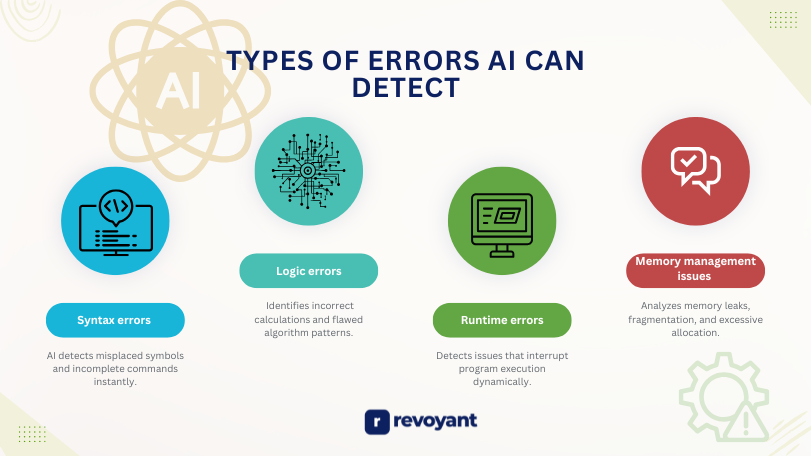
AI can spot mistakes in code fast, saving developers time. It handles tricky issues like bugs that crash programs or make them act strangely.
Syntax errors
Syntax errors disrupt code execution. They occur when the rules of a programming language are disregarded. Frequent issues involve omitted semicolons, mismatched brackets, or incorrect keyword usage in scripting and functional programming in JavaScript.
AI in code debugging tools quickly identify these problems. Microsoft Copilot identifies misplaced symbols or incomplete commands instantly. It detects infinite loops and recommends break conditions to resolve them. This accelerates editing and enhances site stability.
Logic errors
Logic errors differ from syntax errors as they occur despite having a proper code structure. They arise when the program executes but generates incorrect outcomes due to flawed algorithms or incorrect calculations. Using “+” instead of “-” in a financial formula, for instance, can result in inaccurate balances.
AI tools such as SHAP and LIME assist in identifying these problems by reviewing behavior-driven development patterns. They track how data moves through your RESTful API or modular architecture, detecting points where logic fails.
Runtime errors
Runtime errors occur during code execution. These interrupt programs while they are running, unlike syntax errors identified earlier. Examples include dividing by zero, accessing invalid memory locations, or file handling problems when the file is missing.
Quiet failures can make them challenging to identify. Subtle bugs may operate without apparent crashes but produce incorrect outputs. AI in code debugging tools such as IntelliJ IDEA AI Debugger or TensorBoard identify these effectively by analyzing dynamic code processes.
Memory management issues
Incorrect memory handling causes crashes and slowdowns. AI tools such as TensorBoard can identify these issues early by evaluating data models and outcomes. They highlight leaks, fragmentation, or excessive allocation instantly.
Improper handling of objects and cookies results in wasted system resources. Generative AI recommends solutions for improved code efficiency. This enhances user interfaces and guarantees seamless DevOps integration across business processes.
Effective Strategies for Using AI in Debugging
Use AI tools alongside manual debugging for better results. Fine-tune inputs to get accurate bug fixes and suggestions.
Combining AI tools with traditional debugging methods
Use tools like GitHub Copilot and Tabnine alongside traditional debugging methods to achieve better outcomes. Begin drafting with Copilot and review the code using DeepCode’s analysis. AI offers rapid solutions, but manual validation guarantees precision.
Place breakpoints or step through your code while using AI recommendations. Blend machine-generated insights with hands-on troubleshooting to identify logic errors or edge cases that automation might overlook. This strategy enhances dependability and significantly reduces debugging time.
Leveraging prompt engineering for accurate results
Fine-tuned prompts guide AI in code debugging tools to deliver accurate results. Prompt engineering aids in dividing tasks into simpler and clearer instructions, significantly improving suggestions and error detection precision. Developers can give detailed inputs on code structure or desired outputs.
UltraAI.app offers an improved prompt design with its logging feature for monitoring interactions. A/B testing helps maintain reliable model performance during coding tasks. Integrating these methods improves usability and promotes easy-to-navigate interfaces for debugging processes.
Validating AI-generated solutions
Test AI-suggested fixes in a controlled setting. Check functionality and compatibility with the AI in code debugging tools before applying them to production code. Run performance metrics like response time and error rates after implementation.
Keep detailed logs of changes made by AI solutions. Match results against manual reviews—or combine them with traditional methods—for better quality assurance.
Common Challenges in AI Debugging
Relying too much on AI tools can mislead developers. Complex bugs may need human skills to solve.
Over-reliance on AI tools
Overusing AI in code debugging tools can cause problems. False positives waste time by flagging non-issues, reducing efficiency. Irrelevant suggestions may confuse developers instead of helping them solve coding errors quickly.
AI often needs access to code repositories, raising privacy and security concerns for companies. Sensitive data might be exposed to external systems, increasing risks of breaches or misuse.
Human oversight remains critical for reviewing AI-generated outputs and ensuring their reliability.
Difficulty in debugging complex edge cases
Complex edge cases frequently result in silent failures. These failures are unforeseen and difficult to identify, particularly within large datasets AI utilizes in code debugging tools. AI encounters difficulty with unusual patterns or behaviors absent during training, causing incomplete resolutions.
Detecting errors becomes more challenging when various factors intersect. For instance, runtime problems combined with memory management errors create confusion for even advanced systems like Microsoft Copilot or TensorBoard.
Human supervision remains essential for addressing such issues efficiently.
Best Practices for AI in Code Debugging
Use AI tools alongside human checks to catch errors quickly. Keep debugging workflows simple, and update your tools often for better results.
Regularly updating AI tools
AI tools require consistent updates to remain efficient. Developers issue patches to address bugs or enhance precision. These updates ensure AI in code debugging tools remain synchronized with the newest programming languages and methods.
Without frequent updates, AI tools could overlook new syntax mistakes or underperform in advanced situations.
Modernized tools manage intricate data flows more effectively. They monitor input-output patterns with greater precision, minimizing coding mistakes related to memory management or runtime problems.
Regular patches improve features focused on user experience, such as generative suggestions and error descriptions powered by natural language processing (NLP).
Training AI models with relevant datasets
Training AI requires high-quality data. Developers should utilize diverse, clean datasets to reflect real coding scenarios. Relevant examples assist models in identifying syntax errors or runtime issues across various programming languages.
Tools like TensorBoard help in visualizing training progress and results. It demonstrates how AI processes patterns effectively by showcasing decision paths. Models trained on up-to-date, domain-specific data improve accuracy for user-friendly debugging tools.
Error detection becomes more effective when datasets feature rare edge cases and frequent bugs from devops integration processes. This increases adaptability and sharpens precision—leading directly to the next section: Maintaining human oversight in critical debugging tasks!
Ensuring human oversight in critical debugging tasks
Human involvement avoids complete dependence on AI in code debugging tools. AI can overlook subtle logic errors or manage context inadequately during tasks such as refractor updates in DevOps integration. Developers should examine AI suggestions closely, particularly for intricate edge cases or critical systems.
Microsoft Copilot and IntelliJ IDEA AI Debugger make several steps more efficient but still require supervision. Providing clear explanations of errors remains crucial. Without human oversight, unnoticed coding flaws might impact extensibility or fluent interface designs.
The Future of AI in Debugging
AI will predict errors, make debugging smoother, and blend well with coding tools—stay curious for what’s next!
Predictive error detection
Predictive error detection spots issues before they happen. It uses machine learning to find patterns in code that might cause future errors. Developers can then fix problems faster, avoiding bugs during runtime.
This saves time and improves software quality.
AI tools analyze thousands of error cases from previous data. They predict potential syntax mistakes or logic flaws early, reducing debugging time by up to 50%. These tools work well with DevOps integration, making code reliable and cutting costs for businesses using artificial intelligence (AI).
Seamless integration with coding environments
AI tools like GitHub Copilot integrate seamlessly into coding platforms. They provide real-time suggestions within environments such as Visual Studio Code, saving significant debugging time. Developers can write and fix code without needing to switch between multiple tabs or tools.
DeepCode contributes by scanning the written code to identify potential issues immediately. These systems improve workflows in DevOps integration setups. This maintains efficiency and minimizes disruptions during coding sessions.
AI in Code Debugging becomes quicker and far more accurate with these advanced AI capabilities.
Customizable AI debugging prompts
Developers can create unique debugging prompts to align with specific workflows. These prompts help AI tools identify bugs, test components, or provide solutions based on distinct project requirements. Modifying prompts helps the AI concentrate on relevant patterns and issues.
Custom workflows integrating different models enhance precision. Teams utilizing Microsoft Copilot may refine their suggestions by incorporating other tools, like TensorBoard, for data tracking. This flexible approach increases error detection effectiveness and produces improved outcomes.
Conclusion
AI in code debugging tools is transforming software development by enhancing error detection, improving code quality, and streamlining workflows. Tools like Microsoft Copilot and IntelliJ IDEA AI Debugger offer seamless integration with popular IDEs, making them highly effective for everyday coding tasks. Metabob brings a unique approach with AI-driven logic analysis, while TensorBoard is a specialized solution for debugging machine learning models. Each tool caters to different needs, whether it’s real-time debugging, security analysis, or optimization for AI-driven applications.
While these tools significantly boost efficiency, developers must balance AI assistance with manual validation to ensure accuracy, security, and maintainability. Choosing the right AI code assistant depends on factors like integration, language support, security requirements, and project scale. As AI continues to evolve, these tools will become even more sophisticated, helping developers write cleaner, more efficient, and more secure code. Leveraging AI in code debugging while maintaining human oversight ensures the best development outcomes.
Frequently Asked Questions
How can AI help with code debugging?
AI in code debugging tools quickly find errors in your code, saving time and effort. They analyze patterns, suggest fixes, and improve efficiency for developers.
Can AI be used with DevOps integration?
Yes, AI works well in DevOps. It automates error detection during deployment, monitors systems on the web, and ensures smoother workflows.
Are there any benefits of using AI for beginners learning to code?
Absolutely! Tools powered by AI simplify debugging for beginners—like those doing an Hour of Code—by identifying mistakes fast and offering clear solutions.
Does SEO matter when using AI in code debugging tools?
SEO is important if you’re building web-based applications or platforms. Using AI helps optimize performance while ensuring clean, error-free code that improves search rankings efficiently.


